


 14 / 27

Cumulative progression rate (%)
1. Kudo M
et al
.
Lancet
. 2018;pii:S0140-6736(18)30207–1 ; Supplementary Appendix
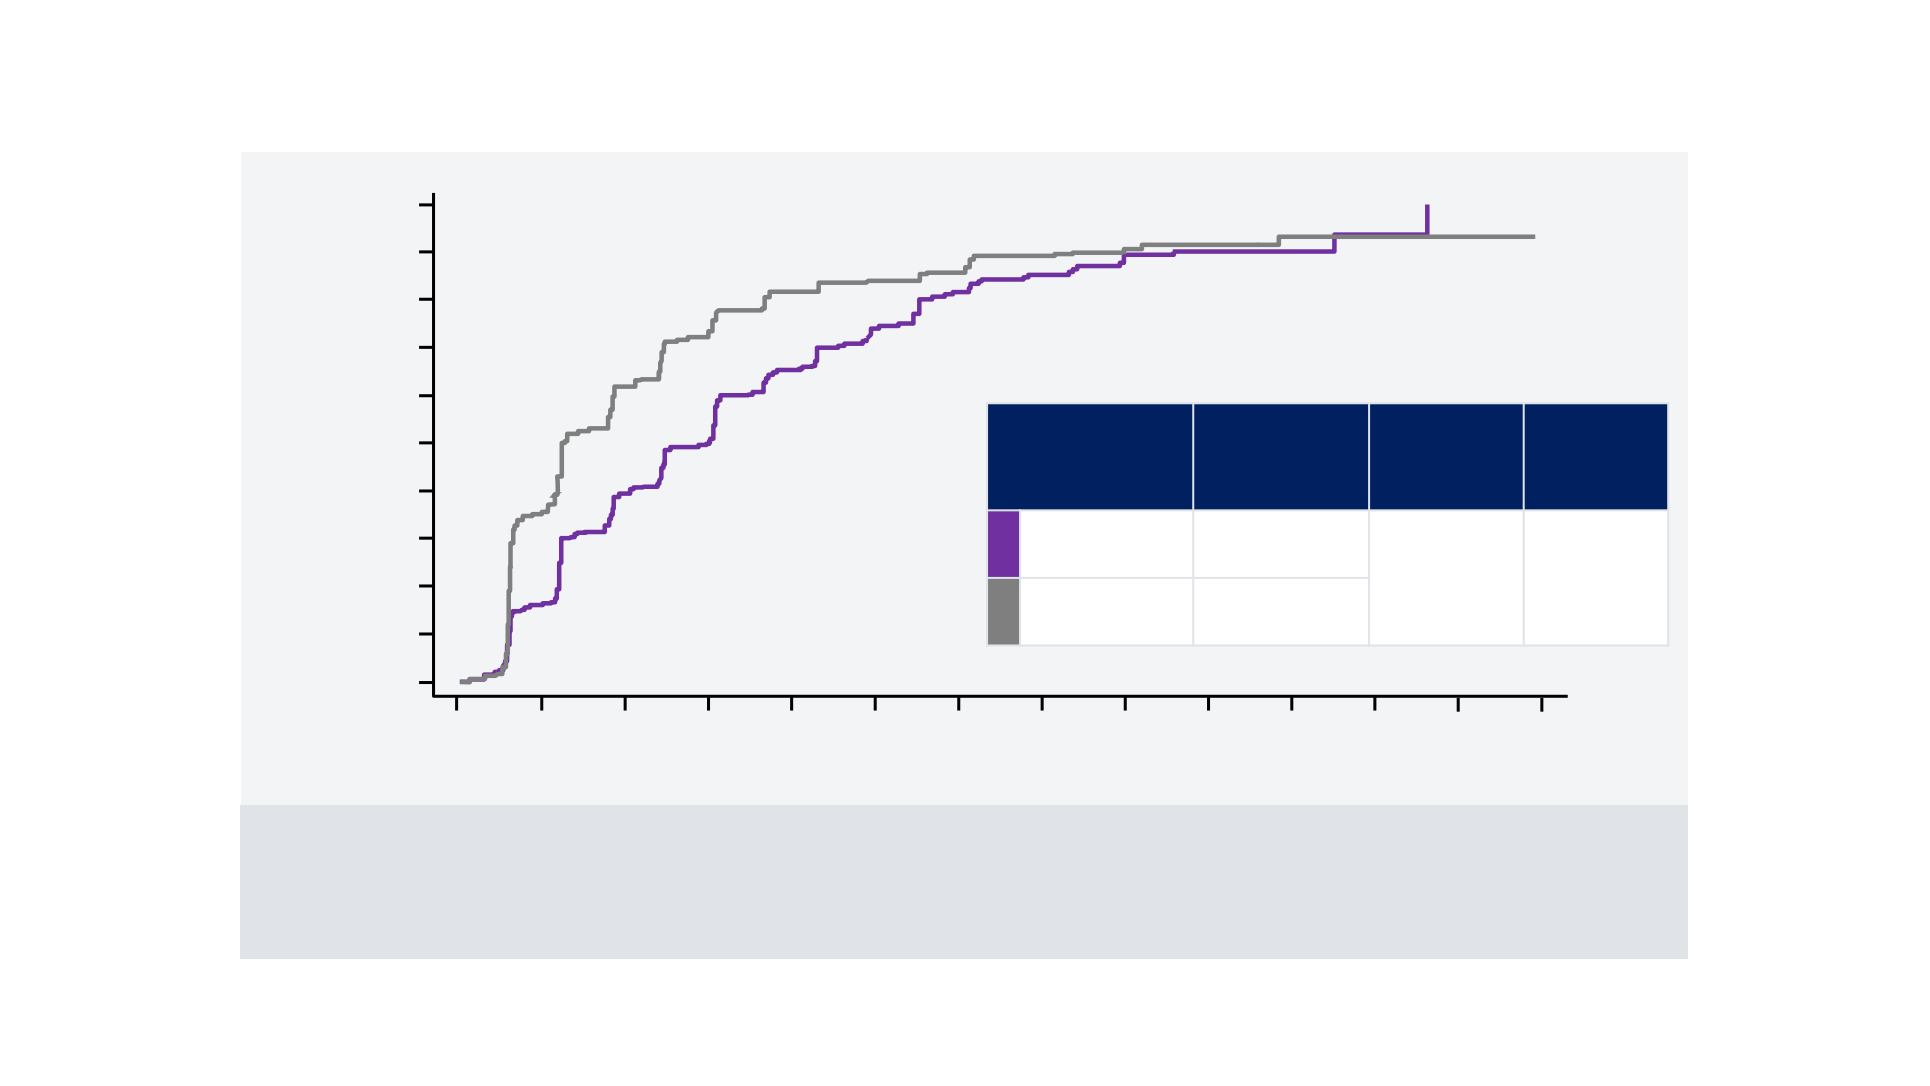
REFLECT TRIAL
Secondary Endpoint: Kaplan-Meier Estimate of TTP
0.9
0.8
0.7
0.6
0.5
0.4
0.3
0.2
0.1
0.0
1.0
+ ++++
++ ++++++ ++ ++++ +++++ ++++
+ +++ + ++ +++ + +
+ ++ + ++ + + + + + +
+
+
+
+ +
+
+ ++ +++++++ ++ ++++++
++
+++++
+++
+
+++++
+
+
0
3
6
9
12
15 18 21 24
27 30 33 36 39
Time (months)
Number of patients at risk:
Lenvatinib
478 341 218 170 106 69 43 28 14 9 4 2 0 0
Sorafenib
476 258 139 94 55 41 33 22 14 9 4 2 2 0
CI = confidence interval; HR = hazard ratio; TTP = time to progression.
TTP, months
(95% CI)
HR
(95% CI)
Log-rank
test:
p-value
Lenvatinib
8.9
(7.4, 9.2)
0.63
(0.53, 0.73)
<0.00001
Sorafenib
3.7
(3.6, 5.4)