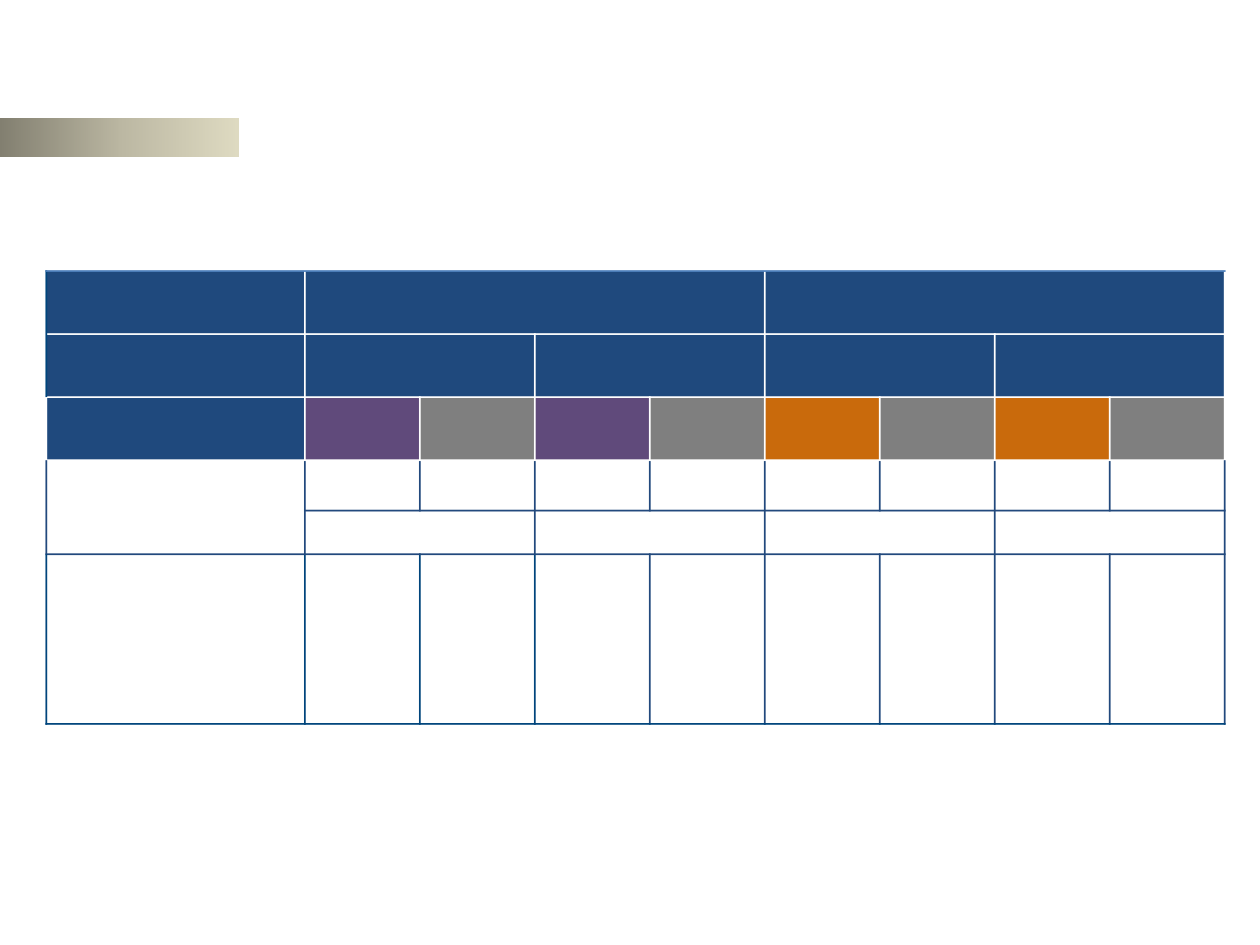
ANTITUMOR ACTIVITY BY TUMOR PD-L1 EXPRESSION LEVEL
IMDC intermediate/poor risk
Intention to treat
PD-L1 <1%
PD-L1 ≥1%
PD-L1 <1%
PD-L1 ≥1%
Outcome
NIVO + IPI
N = 284
SUN
N = 278
NIVO + IPI
N = 100
SUN
N = 114
NIVO + IPI
N = 386
SUN
N = 376
NIVO + IPI
N = 113
SUN
N = 127
ORR,
a
% (95% CI)
37
(32–43)
28
(23–34)
58
(48–68)
22
(15–31)
36
(31–41)
35
(31–40)
53
(44–63)
22
(15–30)
P
= 0.0252
P
< 0.0001
P
= 0.8799
P
< 0.0001
BOR,
a
%
Complete response
Partial response
Stable disease
Progressive disease
NA
7
30
36
20
7
1
27
47
13
12
16
42
19
14
9
1
21
40
25
13
9
27
39
18
7
2
33
43
11
11
14
39
25
14
8
1
21
43
23
13
a
IRRC-assessed
Exploratory endpoint
Motzer RJ, et al. N Engl J Med 2018;378(14):1277-90


