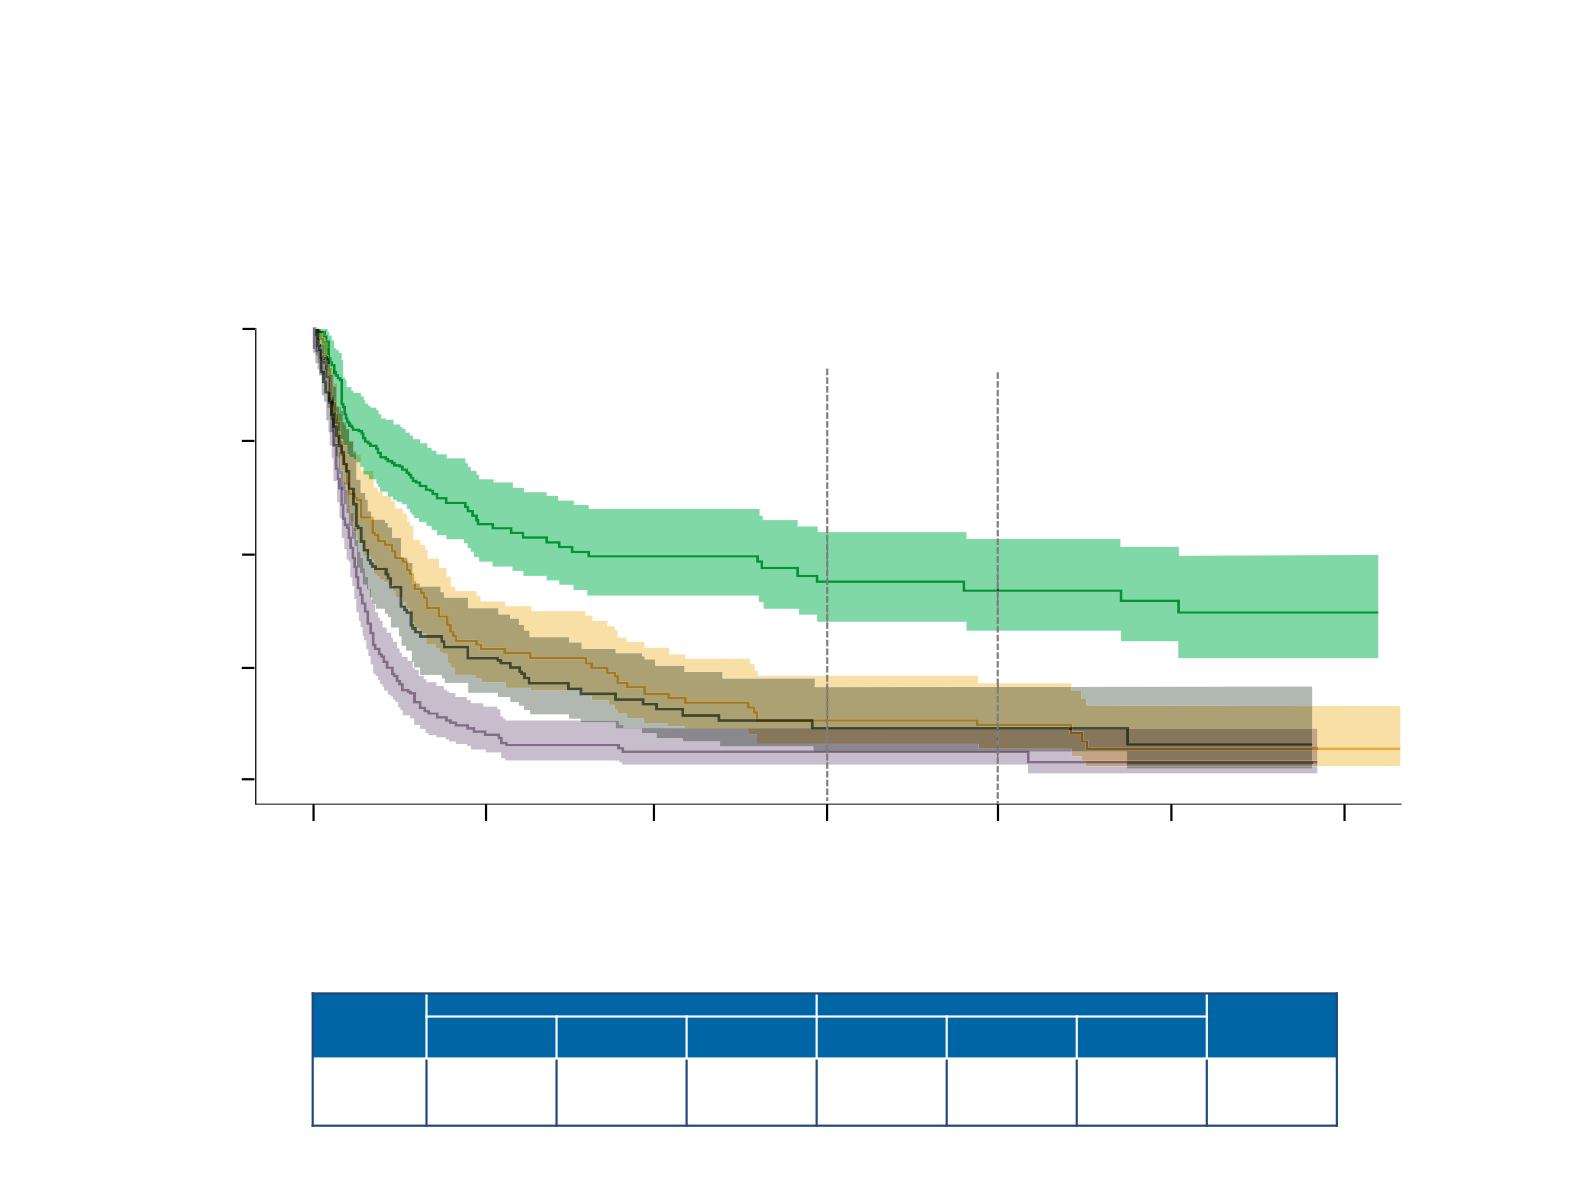
TFS in IMDC intermediate/poor-risk patients who
discontinued protocol therapy and had CR/PR or SD as
best response to treatment
24
•
CheckMate 214
Time from treatment discontinuation (months)
0
6
No. at risk
NIVO+IPI, CR/PR
117
59
45
30
23
15
3
NIVO+IPI, SD
104
29
18
11
7
3
1
SUN, CR/PR
104
24
14
7
5
1
0
SUN, SD
162
16
9
6
3
1
0
12
18
24
18 months
24 months
30
100
75
50
25
0
36
Patients free from second-line treatment (%)
NIVO+IPI, CR/PR
NIVO+IPI, SD
SUN, CR/PR
SUN, SD
P
value
SUN
Median TFS, mo
at 18 mo, %
at 24 mo, %
vs SUN)
Shaded area around curves represents 95% CI; NE, not estimable
a
Based on investigator assessment of response
Subgroup
NIVO+IPI
SUN
P
value
(NIVO+IPI vs
SUN)
Patients in TFS
at 18 mo, %
Patients in TFS
at 24 mo, % Median TFS, mo Patients in TFS
at 18 mo, %
Patients in TFS
at 24 mo, % Median TFS, mo
Response
a
CR/PR
SD
44 (35–55)
14 (8–23)
42 (34–54)
12 (7–21)
9.6 (5.7–NE)
2.8 (1.6–3.9)
12 (6–21)
6 (4–12)
12 (6–21)
6 (4–12)
1.9 (1.5–3.1)
1.4 (1.1–1.6)
<0.0001
0.0001


