


 9 / 27

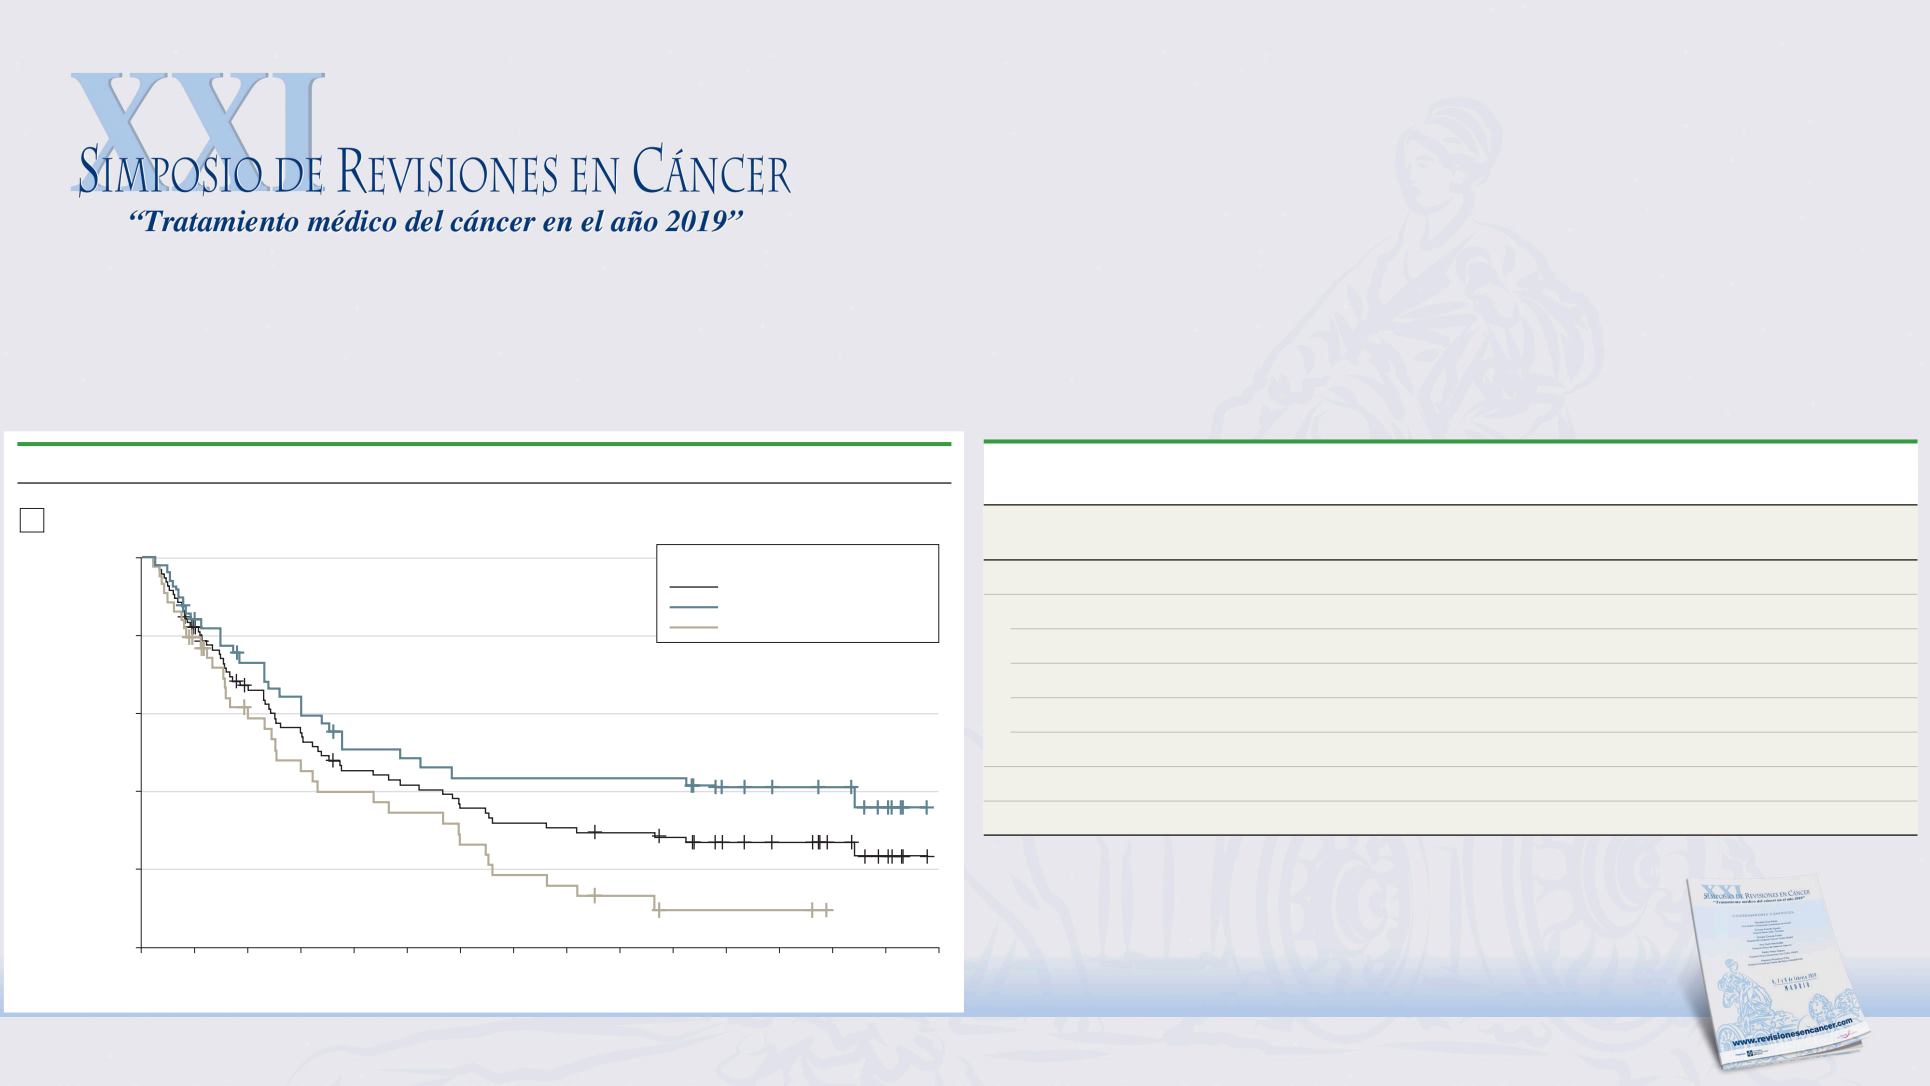
Figure 2. Overall Survival (OS) by Programmed Death Ligand 1 (PD-L1) Status and Key Clinical Subgroups
Kaplan-Meier plot of OS
A
0
100
80
60
40
20
0
45
42
39
36
33
30
27
24
21
18
15
12
9 6 3
OS, %
9
9
5
5
95
50
72
39
56
33
46
29
37
22
34
21
29
19
26
19
25
19
23
19
21
19
16
14
13
11
1-Year OS: 45%
2-Year OS: 31%
3-Year OS: 27%
1-Year OS: 51%
1-Year OS: 40%
2-Year OS: 44%
2-Year OS: 16%
3-Year OS: 42%
3-Year OS: 10%
Time, mo
No. at risk
All patients
IC2/3
Median OS (95% CI), mo
All patients: 10.1 (7.3 to 17.0)
IC2/3: 14.6 (9.0 to NE)
IC0/1: 7.6 (4.7 to 13.9)
Research
Original Investigation
Atezolizumab Monotherapy for Patients With Metastatic Urothelial Cancer
Figure 1. Duration of Treatment and Response in Patients With Metastatic Urothelial Cancer Treated With Atezoli
PR
PR/PR
a
PR
1 y
2 y
3 y
Table 3. Objective Response Rates to Atezolizumab Treatment and Duration of Response
by Programmed Death Ligand 1 Immunohistochemical Status
Parameter
IC0/1
(n = 44)
IC2/3
(n = 50)
All Patients
(N = 95)
a
Objective response rate (95% CI)
b
11 (4 to 25)
40 (26 to 55)
26 (18 to 36)
Best overall response, No. (%)
Complete response
1 (2)
8 (16)
9 (10)
Partial response
4 (9)
12 (24)
16 (17)
Stable disease
9 (21)
9 (18)
18 (19)
Progressive disease
24 (55)
17 (34)
42 (44)
No assessment
c
6 (14)
4 (8)
10 (11)
Duration of response, mo (range)
27.6 (6.2 to >34.3)
18.0 (2.8 to >41.0)
22.1 (2.8 to >41.0)
Atezolizumab Monotherapy for Pati nts With Metastatic Urothelial Cancer
predicts outcome in metastatic
urothelial cancer treated with
atezolizumab
Petrylak, DP et al. JAMA Oncol 2018
N=95, Phase I atezolizumab in monotherapy
PD-L1 IC expression, SP142