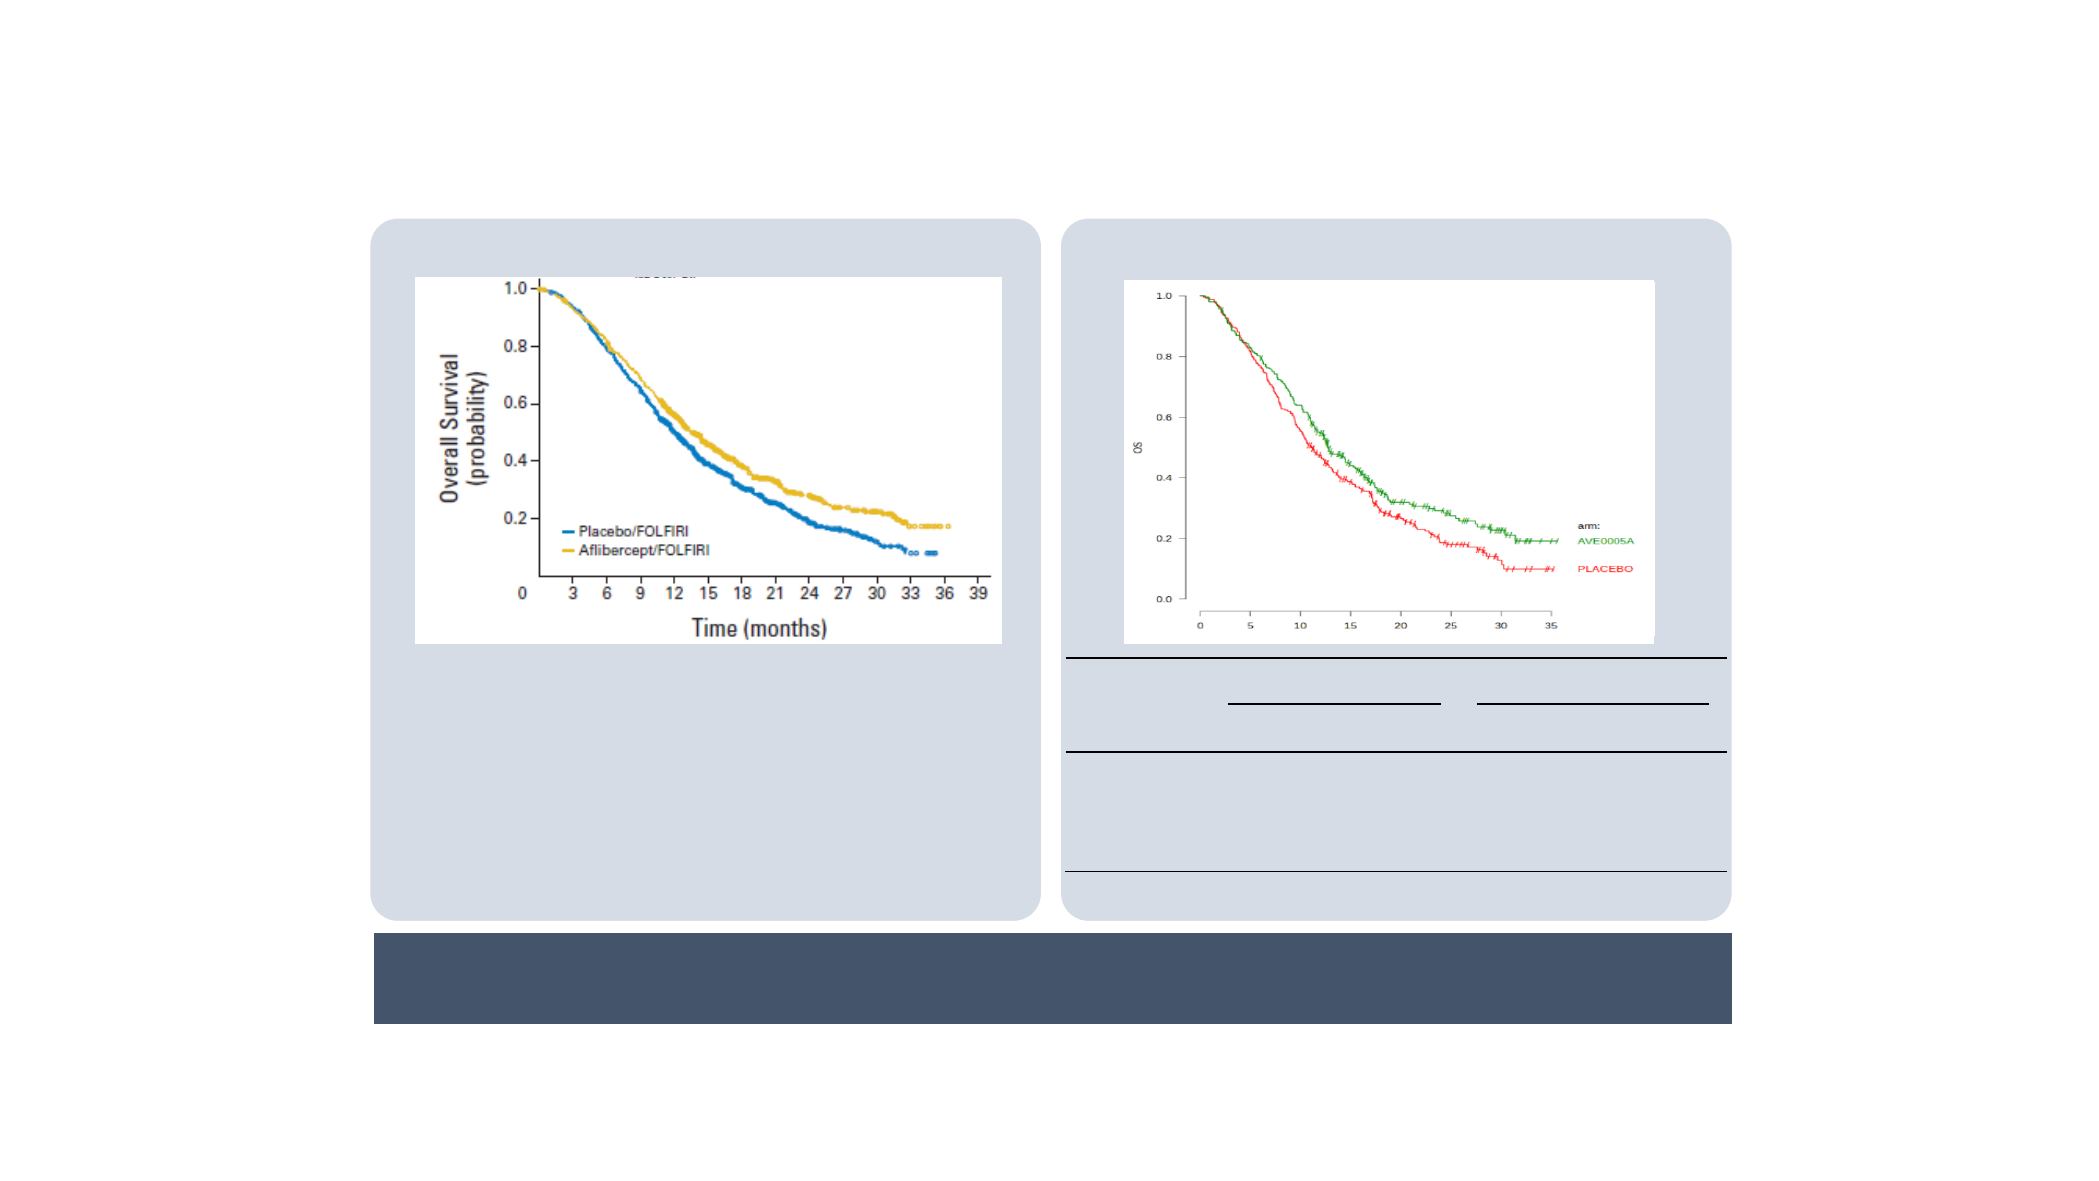
Biomarker Population (n=482) Appears to Be Representative of ITT Population (n=1226)
•
Biomarker population representative of ITT
population (based on OS curves)
•
Similar HR
•
Similar shape of the curves incl. long-term
•
Similar demographics except fewer samples
from patients in the Americas
Evaluable population for
biomarkers
ITT population
Placebo/ Folfiri
(N=265)
Aflibercept/ Folfiri
(N=288)
Placebo/ Folfiri
(N=614)
Aflibercept/ Folfiri
(N=612)
Prior bevacizumab [n
(%)]
Number
265
288
614
612
Yes
79 (29.8%)
90 (31.3%)
187 (30.5%)
186 (30.4%)
No
186 (70.2%)
198 (68.8%)
427 (69.5%)
426 (69.6%)
ITT
Biomarker Population
HR = 0.817 (0.713-0.937)
P = 0.0032
HR = 0.804 (0.656-0.985)
P = 0.03
There is no formal test to compare the biomarker and ITT populations; populations were assessed by
comparing the shape of the curves, the HRs, and the patient characteristics.
Tejpar, World GI 2017


