


 29 / 34

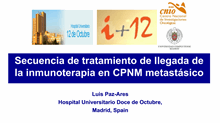
bTMB ≥16 mut/Mb population
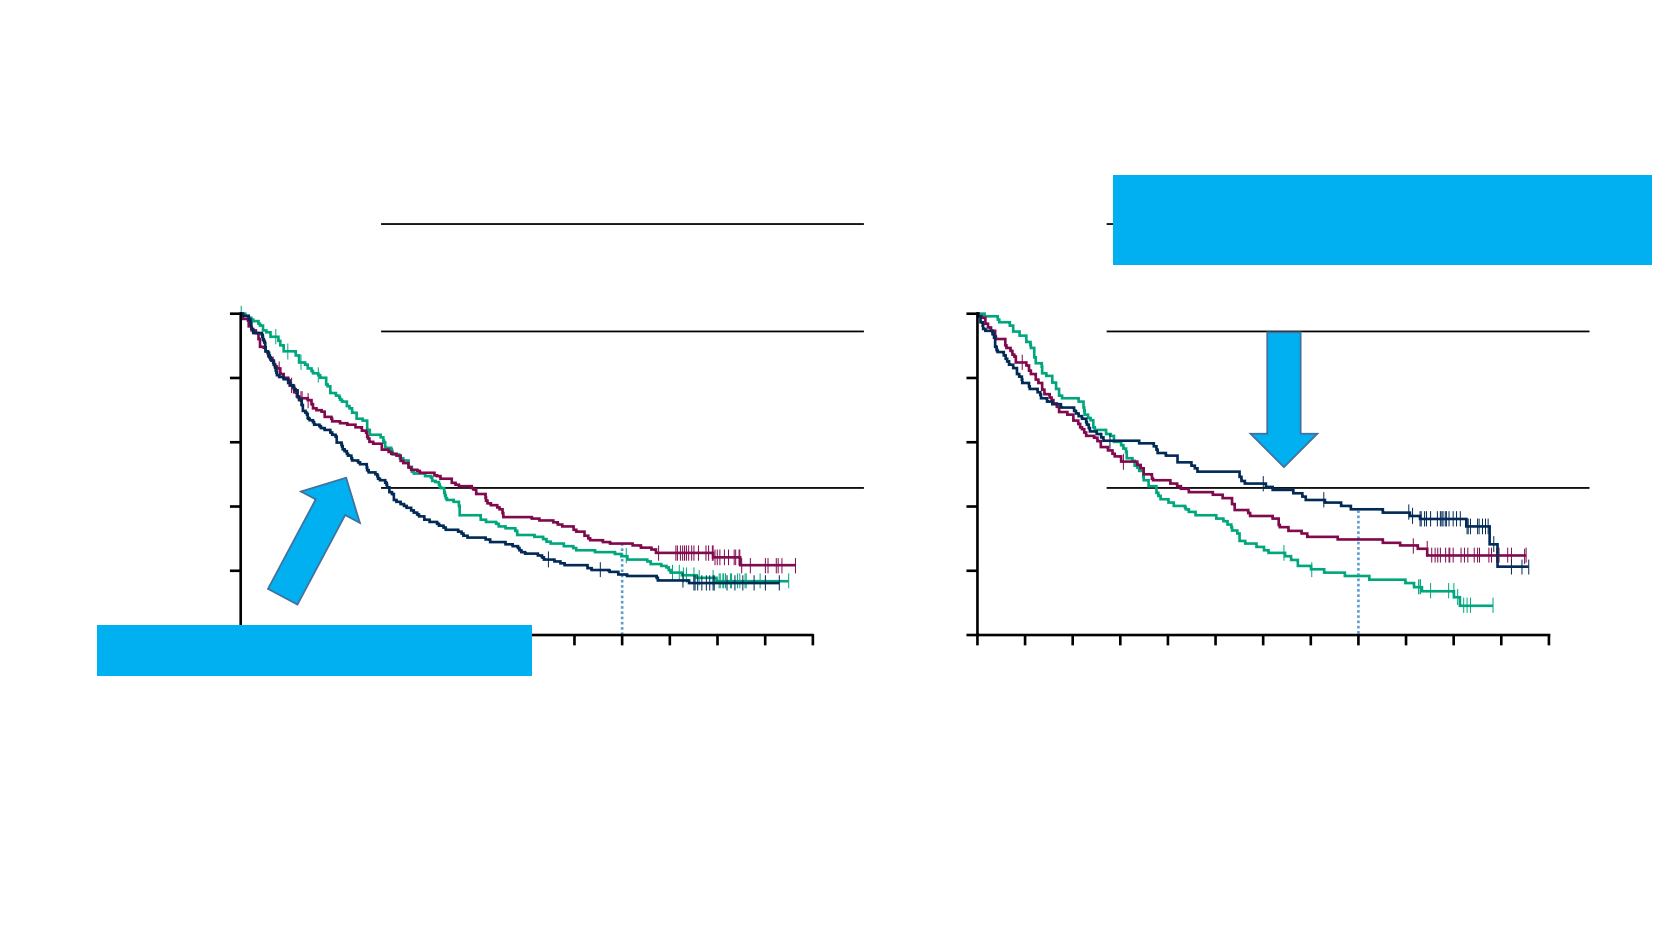
bTMB <16 mut/Mb population
Durvalumab
(n=175)
Durvalumab +
tremelimuma
b
(n=162)
Chemotherapy
(n=153)
mOS
,
months
(95% CI)
12.2
(9.0–15.5)
8.5
(6.6–9.7)
11.6
(9.1–13.1)
HR vs CT*
(95% CI)
0.92
(0.715–
1.174)
1.23
(0.964–1.575)
–
Durvalumab
(n=111)
Durvalumab +
tremelimuma
b
(n=106)
Chemotherapy
(n=102)
mOS
,
months
(95% CI)
11.0
(7.8–16.1)
16.5
(10.3–22.9)
10.5
(8.8–12.4)
HR vs CT*
(95% CI)
0.80
(0.588–
1.077)
0.62
(0.451–0.855)
–
Probability of OS
Time from randomisation (months)
Probability of OS
Time from randomisation (months)
0.0
0.2
0.4
0.6
0.8
1.0
0 3 6 9 12 15 18
36
30
24 21
33
27
0.0
0.2
0.4
0.6
0.8
1.0
0 3 6 9 12 15 18
36
30
24 21
33
27
No. at risk
D
175 138 112 97 85 74 62 55 48 42 17 6 0
D+T
162 128 101 78 57 49 41 34 29 26 12 3 0
CT
153 132 111 90 73 55 46 40 36 29 15 1 0
111 93 75 61 52 47 40 33 32 30 14 3 0
106 83 75 63 58 53 49 43 39 38 20 3 0
102 95 75 61 43 38 28 21 17 16 8 0 0
19%
29%
24%
30%
18%
39%
No role for D+T in TMB low’s
Both D and D+T superior to Cx
Analysis by PD-L1?
MYSTIC Trial
bTMB Analysis
N Rizvi et al., ESMO-IO 2018; :Abstr LBA