


 25 / 34

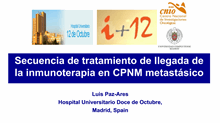
TMB and Tumor PD-L1 Expression Identify Distinct
and Independent Populations of NSCLC
Tumor PD-L1 expression
11
a
Symbols (dots) in the scatterplot may represent multiple data points, especially for patients with <1% tumor PD-L1 expression. The black line shows the relationship between TMB and PD-L1
expression as described by a linear regression model;
b
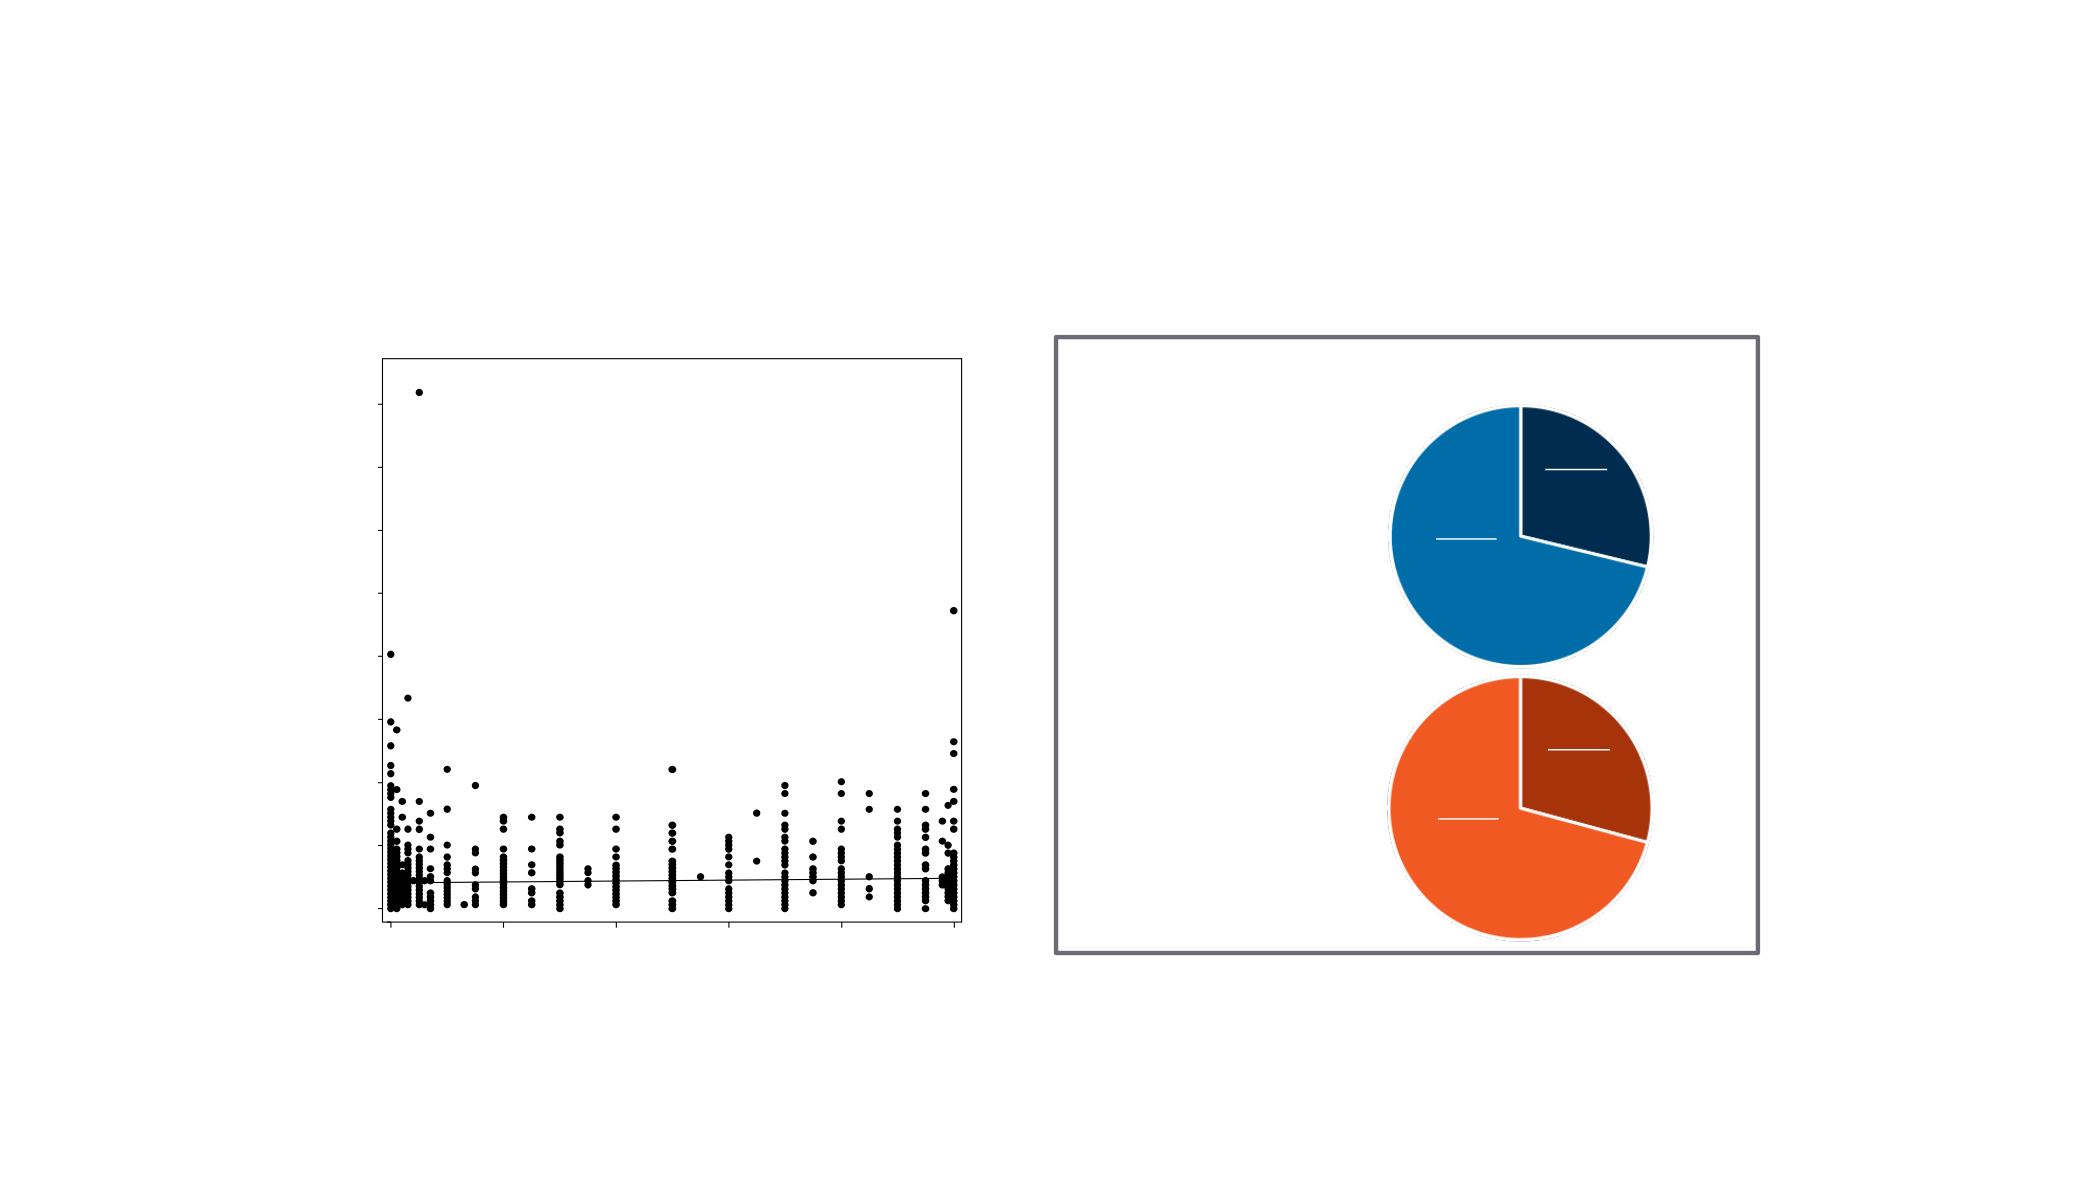
Among patients in the nivolumab +ipilimumab and chemotherapy arms; TMB ≥10 mut/Mb, n = 299; TMB <10 mut/Mb, n = 380
TMB and tumor PD-L1 expression
a
PD-L1 expression (%)
TMB (number of mutations/Mb)
0
20
40
60
80
100
160
120
140
0
20
40
60
80
100
TMB ≥10 mut/Mb
b
TMB <10 mut/Mb
b
<1%
29%
≥1%
71%
<1%
29%
≥1%
71%
<1%
29%
≥1
<1%
29%
≥1%
71%
Hellmann et al., NEJM 2018