


 8 / 32

37% Risk Reduction
for Worst Pain Progression
13
10 8 6
1 2 4 7
Mean change from baseline
in worst pain score (BPI-SF)
0.6
0.4
0.2
0.0
-0.2
-0.4
0 3 5
9 12
ADT + Placebos
ADT + AA + P
15 17
21 19
23 25
Cycle*
27 29 31 33
11
Worse
Better
597
602
456
387
356
246
299
162
218
99
115
44
47
10
2
1
0
Months
6
ADT + Placebos, NR
ADT + AA + P, NR
12
18
24
30
36
42
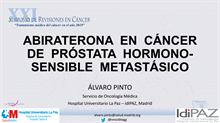
Patients without worst pain
progression (%)
HR 0.63 (95% CI, 0.52-0.77)
P
< 0.0001
100
80
60
20
0
40
Patients at risk
ADT + AA + P
ADT + Placebos
*1 cycle = 28 days.
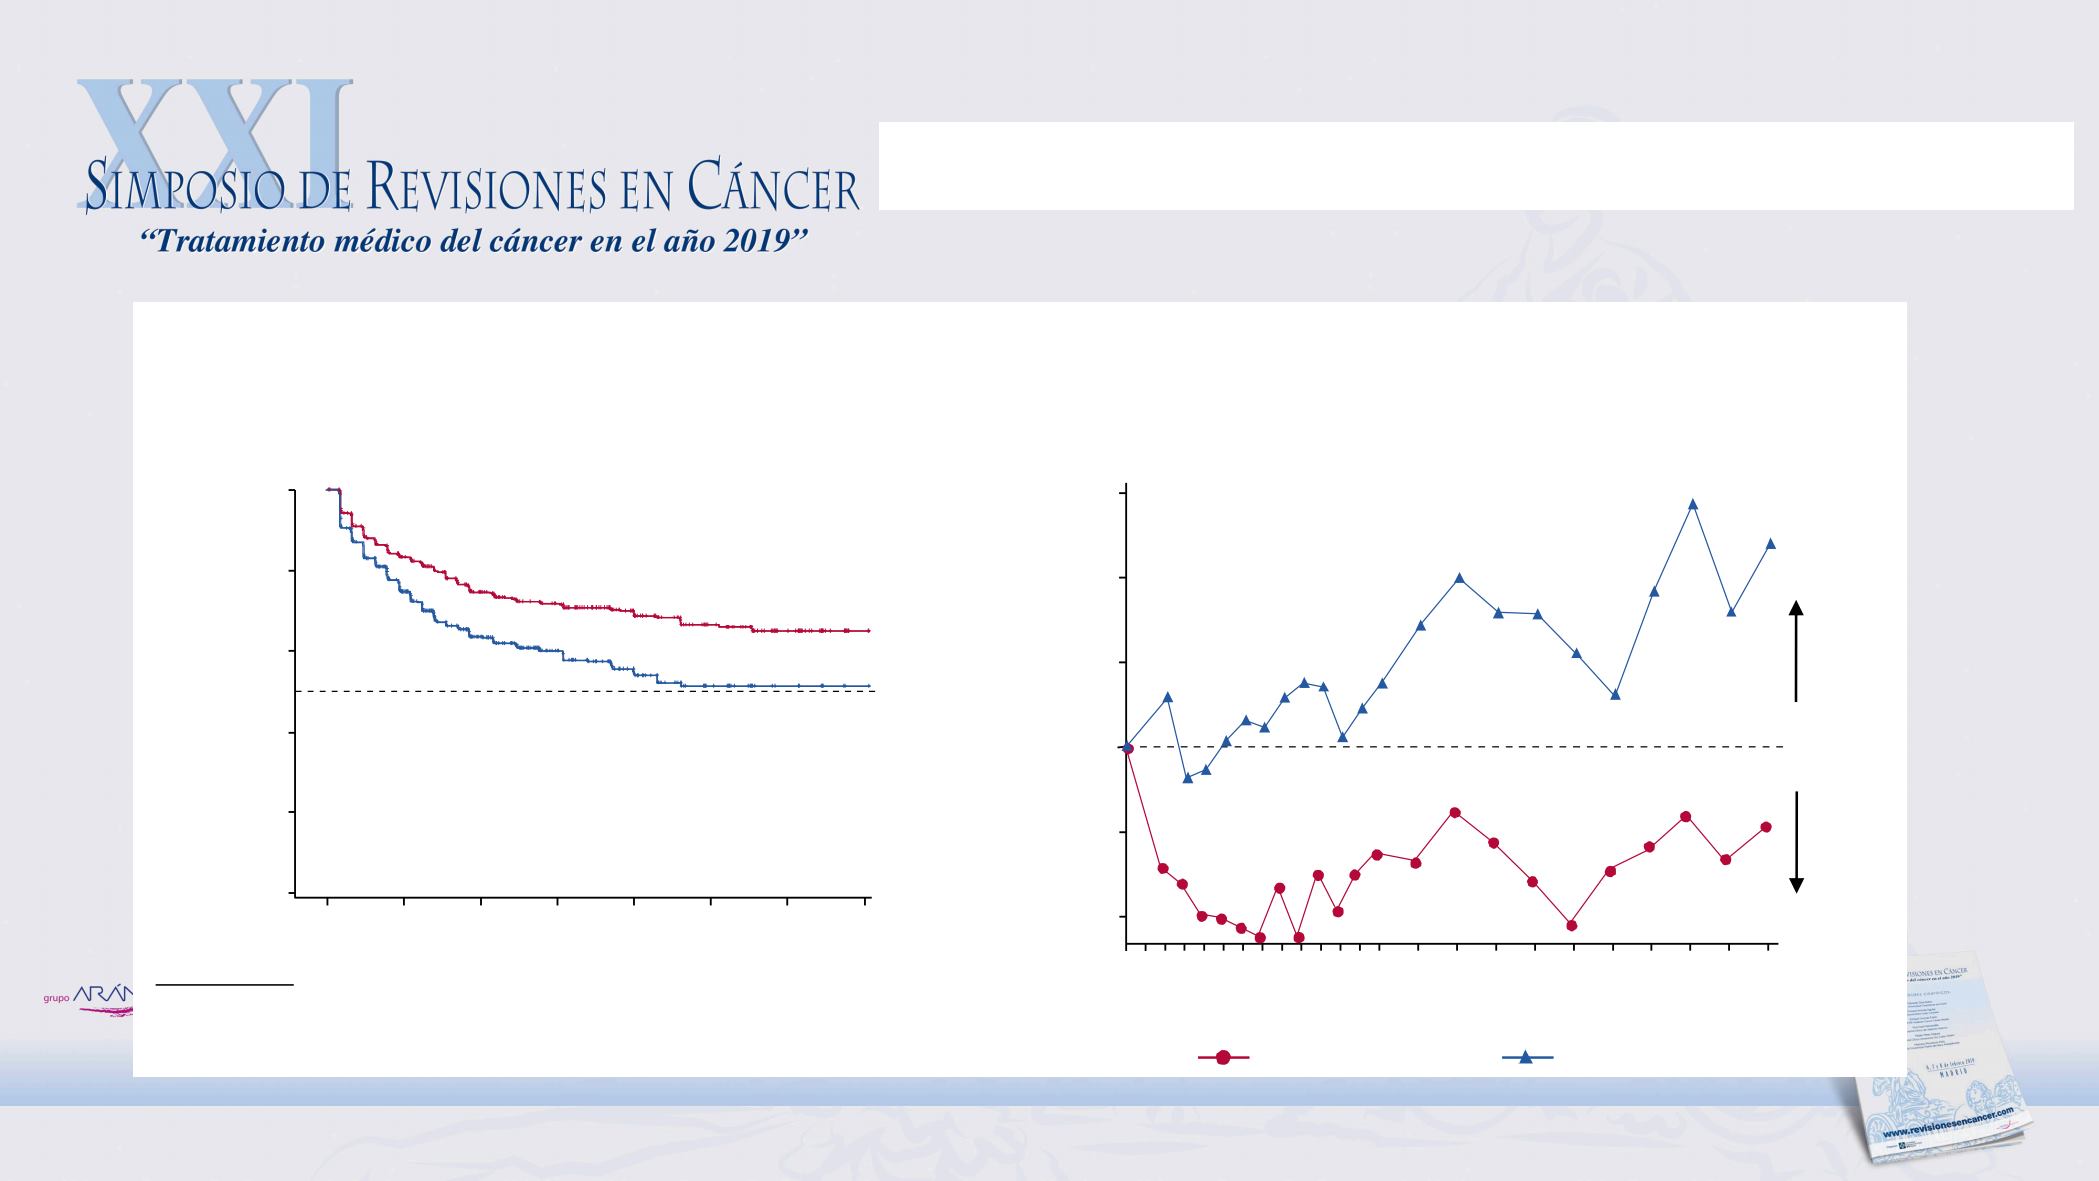
ADT + AA + P Significantly Improved Pain
Mean Change From Baseline
Differed From Cycle 2 Onward
10
37% Risk Reduction
for Worst Pain Progression
13
10 8 6
1 2 4 7
Mean change from baseline
in worst pain score (BPI-SF)
0.6
0.4
0.2
0.0
-0.2
-0.4
0 3 5
9 12
ADT + Placebos
ADT + AA + P
15 17
21 19
23 25
Cycle*
27 29 31 33
11
B
597
602
456
387
356
246
299
162
218
99
115
44
47
10
2
1
0
Months
6
ADT + Placebos, NR
ADT + AA + P, NR
12
18
24
30
36
42
Patients without worst pain
progression (%)
HR 0.63 (95% CI, 0.52-0.77)
P
< 0.0001
100
80
60
20
0
40
Patients at risk
ADT + AA + P
ADT + Placebos
*1 cycle = 28 days.
ADT + AA + P Significantly Improved Pain
Mean Change From Baseline
Differed From Cycle 2 Onward
10