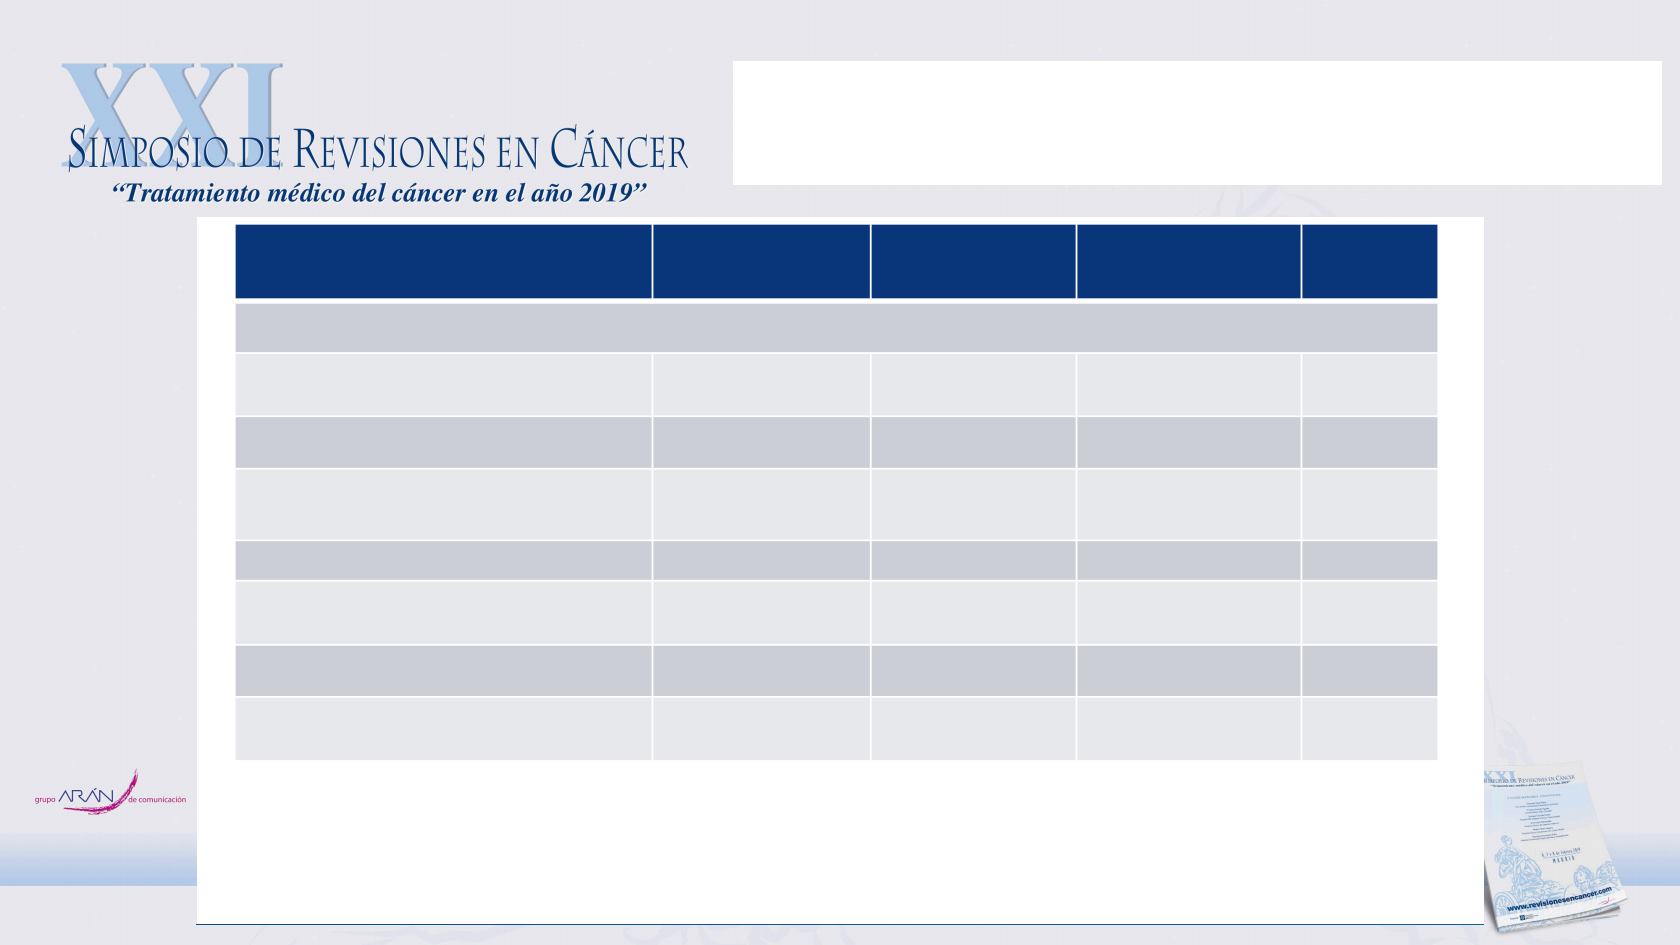
LATITUDE: prespecified secondary and
exploratory endpoints
ADT+AA+P
(n = 597)
ADT+placebos
(n = 602)
Hazard Ratio
(95% CI)
P Value*
Secondary end points
Time to pain progression — mo
NR
16.6
0.70 (0.58–0.83) < 0.001
Time to PSA progression — mo
33.2
7.4
0.30 (0.26–0.35) < 0.001
Time to next symptomatic skeletal
event — mo
NR
NR
0.70 (0.54–0.92)
0.009
Time to chemotherapy — mo
NR
38.9
0.44 (0.35–0.56) < 0.001
Time to subsequent prostate cancer
therapy — mo
NR
21.6
0.42 (0.35–0.50) < 0.001
Exploratory end point
Patients with a PSA response
(decline ≥ 50% from baseline) — % 91
67
1.36 (1.28–1.45)
*
< 0.001
*
Value is odds ratio
§
The superiority of ADT+AA+P over ADT+placebos was observed for all secondary end points
Fizazi K et al. N Engl J Med 2017;377(4):352-360
LATITUDE: prespecified secondary and
exploratory endpoints
ADT+AA+P
(n = 597)
ADT+placebos
(n = 602)
Hazard Ratio
(95% CI)
Secondary end points
Time to pain progression — mo
NR
16.6
0.70 (0.58–0.83)
Time to PSA progression — mo
33.2
7.4
0.30 (0.26–0.35)
Time to next symptomatic skeletal
event — mo
NR
NR
0.70 (0.54–0.92)
Time to chemotherapy — mo
NR
38.9
0.44 (0.35–0.56)
Time
therapy — mo
NR
21.6
0.42 (0.35–0.50)
Exploratory end point
Patients with a PSA response
(decline ≥ 50% from baseline) — % 91
67
1.36 (1.28–1.45)
*
*
Value is odds ratio
§
The superiority of ADT+AA+P over ADT+placebos was observed for all secondary end poin
Fizazi K et al. N Engl J Med 2017


