


 18 / 32

Median OS
3-Year OS rate*, %
HR
(95% Cl)
Control
(months)
Tx
(months)
Control
Tx
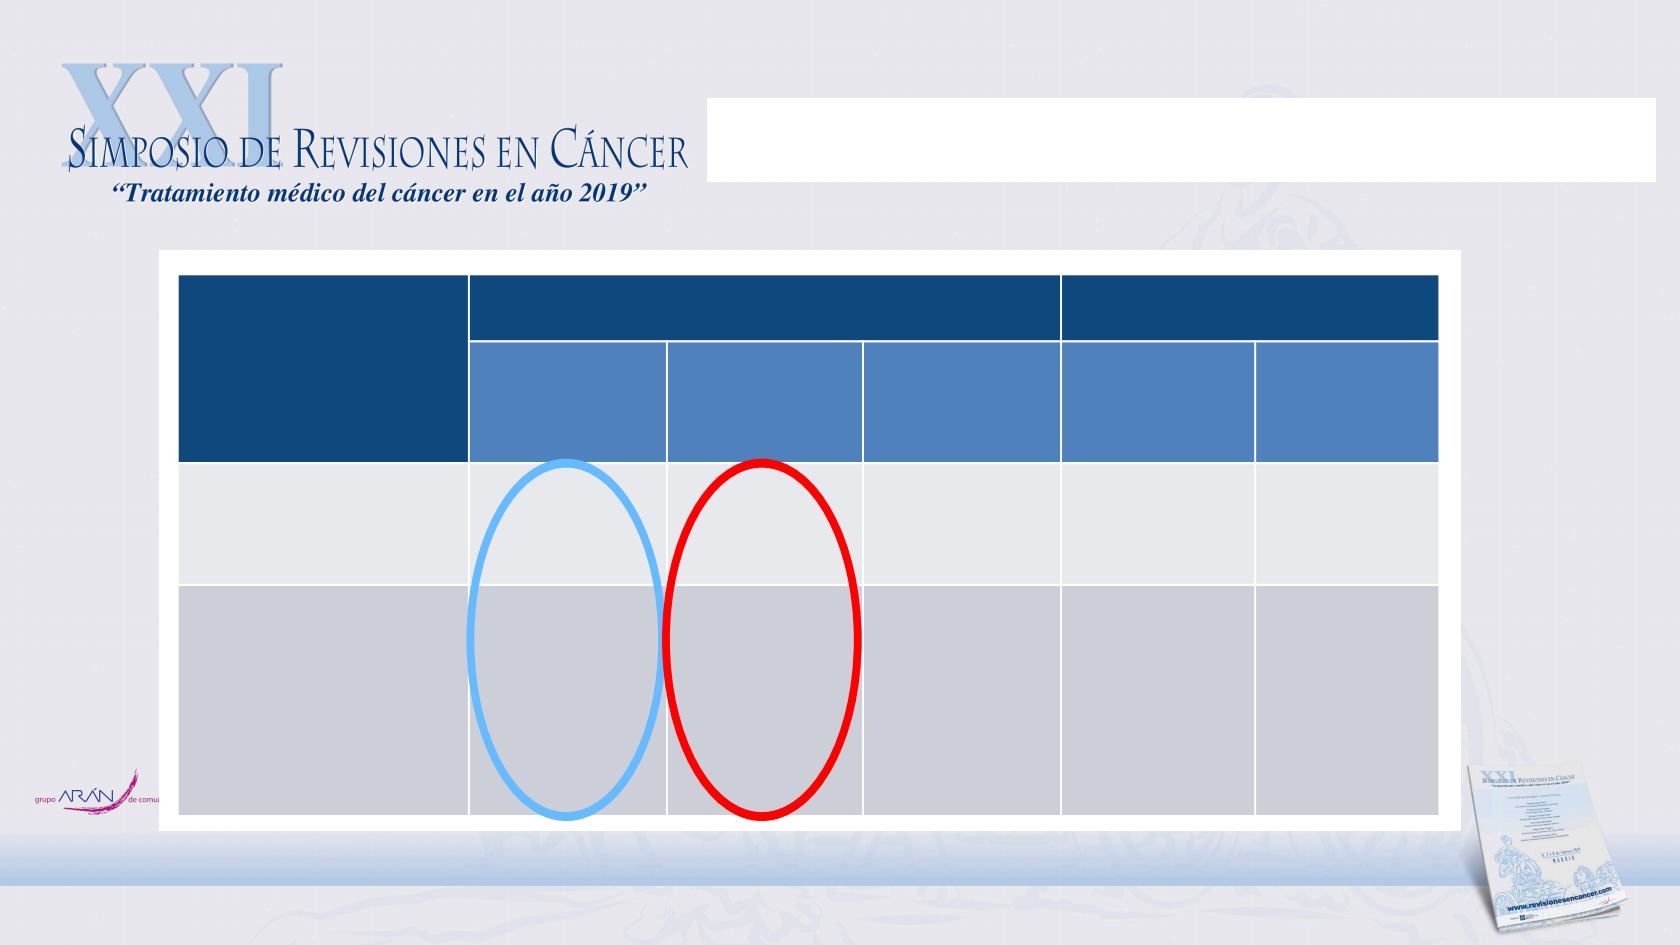
LATITUDE
0.62
(0.51–0.76)
34.7
NR
49
66%
CHAARTED
high metastatic load
0.63
(0.50–0.79)
34.4
51.2
~50
~65
OS comparison: LATITUDE vs CHAARTED
*Estimated using the KM plots.
KM, Kaplan–Meijer; NR, not reached; Tx, treatment.
M dian OS
3-Year OS rate*
HR
(95% Cl)
Control
(months)
Tx
(months)
Control
LATITUDE
0.62
(0.51–0.76)
34.7
NR
49
6
CHAARTED
high metastatic load
0.63
(0.50–0.79)
34.4
51.2
~50
OS comparison: LATI U E vs CHAARTED
*Estimated using the KM plots.
KM, Kaplan–Meijer; NR, not reached; Tx, treatment.
Eric Small, Oral presntation at ASCO 2