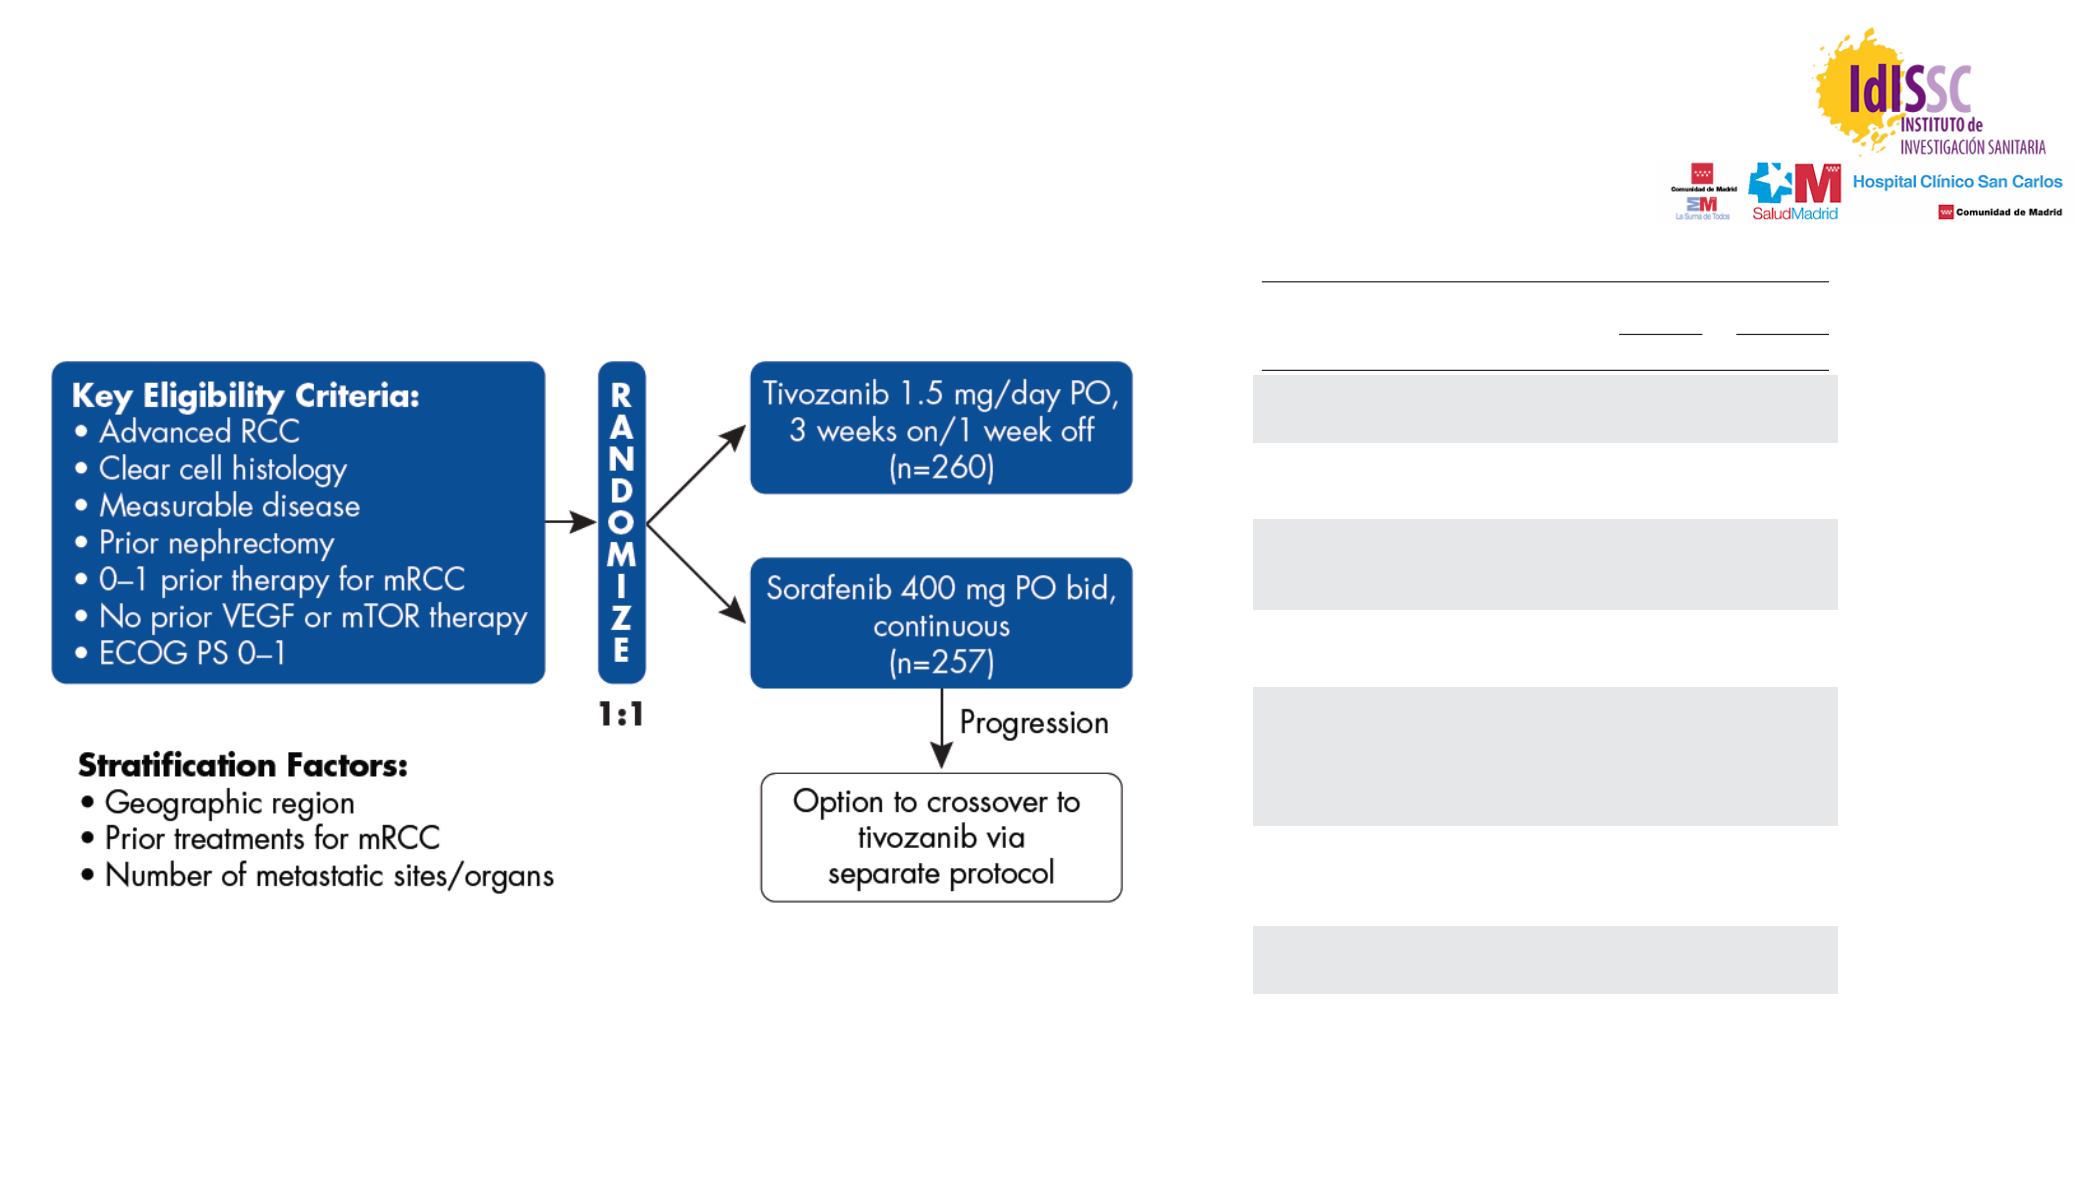
Motzer R, et al. J Clin Oncol 2013
Tivozanib vs Sorafenib: Phase III trial
A famous example
This independent review to confirm investigator-called PD was a separate
process from the third-party review of response performed by the core
imaging laboratory to assess the primary end point. Confirmation of PD
was not required if significant clinical deterioration, appearance of new
lesions, or
!
50% increase in measurable disease per RECIST was noted by
the investigator.
Safety was evaluated by AEs, vital signs, physical examinations, ECOG
PS, ECG, laboratory values, and concomitant medications. AEs were collected
throughout the patients’ participation, including a period of 30 days after the
last dose of study drug. AEs were graded according to the National Cancer
Institute’s Common Terminology Criteria for Adverse Events version 3.0.
HRQoL was assessed with the Functional Assessment of Cancer
Therapy-General (FACT-G),
19
FACT Kidney Symptom Index–Disease-
Related Symptoms (FKSI-DRS),
20
and EuroQol-5D (EQ-5D)
21
question-
naires. These questionnaires were administered on day 1 of each cycle and on
discontinuation from the study drug.
Statistical Methods and Analysis
Target enrollment was 500 patients (250 patients per arm) toobserve 310
events (progression or death) yielding 90% power to detect a difference
(
P
"
.05) between treatment arms with respect to PFS, assuming the median
PFS for patients receiving sorafenib and tivozanib was 6.7 months and 9.7
months, respectively (a projected increase of 3 months or 44.8%). The final
PFS analysis was to be performed after 310 events occurred. Final OS analysis
was to be performed after completion of follow-up for all patients, or after all
patients in the follow-up had been on study for at least 2 years. Assuming the
median OS for patients receiving sorafenib and tivozanib was 18 months and
24 months, respectively, approximately 300 events would be observed by the
time of the final OS analysis, yielding 70% power to detect a difference
(
P
"
.05) between the treatment arms with respect to OS.
Efficacy end points were analyzed in the intent-to-treat (ITT) popula-
tion, which comprised all randomly assigned patients. Safety analyses were
performed in the safety population, which included all randomly assigned
patients receiving at least one dose of study drug.
PFS between treatment arms was compared on the basis of independent
radiology review assessment by using a stratified log-rank test; stratification
factors were the number of prior treatments (0 or 1) and the number of
metastatic sites/organs involved (1 or
!
2). The distribution of the PFS was
estimated by using the Kaplan-Meier method. The hazard ratio (HR) and its
Table 1.
Baseline Demographics and Clinical Characteristics
Characteristic
Tivozanib
(n
#
260)
Sorafenib
(n
#
257)
No.
% No.
%
Age, years
Median
59
59
Range
23-83
23-85
Sex
Male
185 71 189 74
Female
75 29 68 26
Race/ethnicity
White
249 96 249 97
Asian
10 4
8 3
Black
1
"
1
0 0
Time from diagnosis to study entry, years
!
"
1
109 42 105 41
!
1
137 53 137 53
Most common sites of metastasis
Lung
212 82 204 79
Lymph nodes
182 70 166 65
Adrenal gland
78 30 57 22
Liver
67 26 49 19
Bone
61 23 52 20
No. of organs involved
1
76 29 88 34
2
99 38 106 41
!
2
85 33 63 25
ECOG PS
0
116 45 139 54
1
144 55 118 46
MSKCC prognostic group
Favorable
70 27 87 34
Intermediate
173 67 160 62
Poor
17 7 10 4
Prior systemic therapy for metastatic
RCC†
0
181 70 181 70
1
78 30 76 30
Tivozanib Versus Sorafenib as Initial Therapy for Metastatic RCC


