


 5 / 40

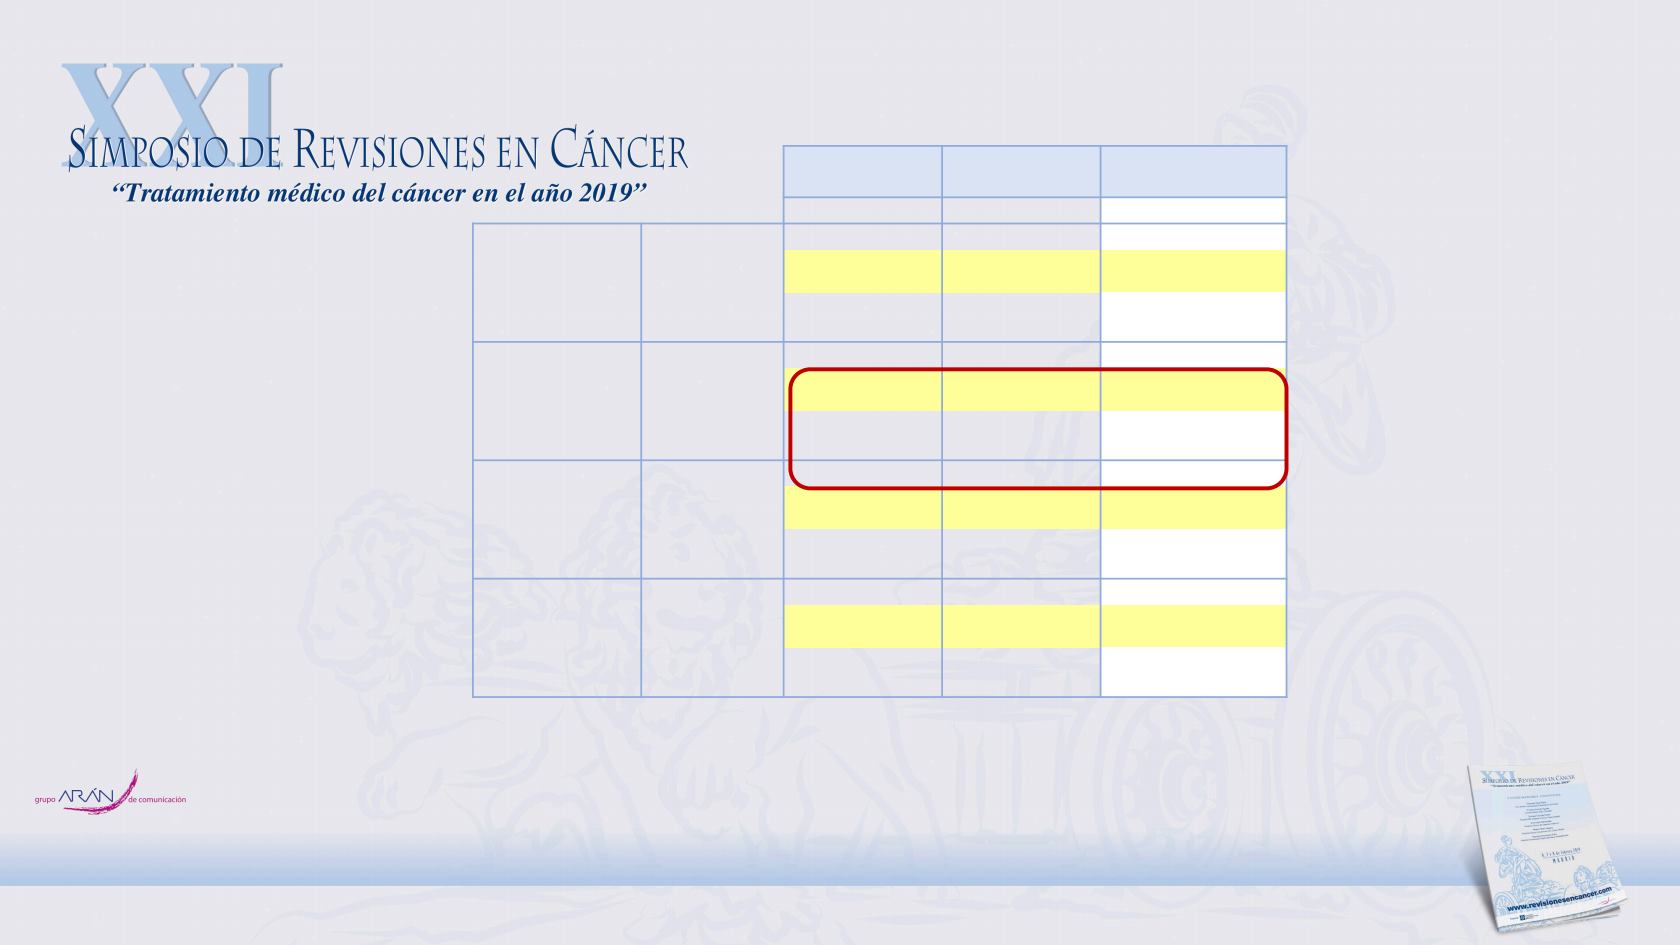
THERASCREEN
PYRO (5%)
COBAS (1%)
NGS 454 GS JUNIOR
(1%)
MUT WT MUT WT MUT
WT
KRAS 2
n
17
144
16
145
49
112
Median (mut/wt),
month
4.14 7.10 4.14
7.1
7.92
5.82
HR (95% CI)
0.78 (0.45-1.33)
0.74 (0.42-1.06)
1.13 (0.77-1.66)
P
0.354
0.299
0.540
All RAS
n
49
112
50
111
82
79
Median (mut/wt),
month
4.44 7.20 4.73
7.2
7.03
6.97
HR (95% CI)
0.59
(0.40-0.87)
0.77 (0.52-1.15)
0.83 (0.58-1.19)
P
0.007
0,203
0.315
All RAS
or
BRAF
n
61
100
59
102
87
74
Median (mut/wt),
month
4.11 7.92 4.44 7.56 6.97
7.03
HR (95% CI)
0.48
(0.33-0.69)
0.67
(0.45-0.98)
0.79 (0.55-1.14)
P
0.000
0.036
0.204
All RAS
or
BRAF
or
PiK3CA
n
68
93
71
90
95
66
Median (mut/wt),
month
4.14 8.84 4.14 8.08 5.91
7.20
HR (95% CI)
0.52
(0.37-0.73)
0.52
(0.36-0.75)
0.67
(0.46-0.97)
P
0.0001
0.001
0.033
Determinación de mutaciones de Ras como predictor de respuesta a
anti EGFR (n = 161).
SELECCIÓN PUNTO DE CORTE en tejido
Adjusted for age, gender, and chemotherapy lines
•
Increasing detection sensitivity to 1% MAF in tissue samples did not improve patients’ selection to anti-EGFR
therapy compared to SOC
•
A 5% mutational threshold in tissue RAS testing was the best cutoff to predict response to anti-EGFR therapy in
mCRC
Vidal et al. WCGIC 2018. Abstract 576