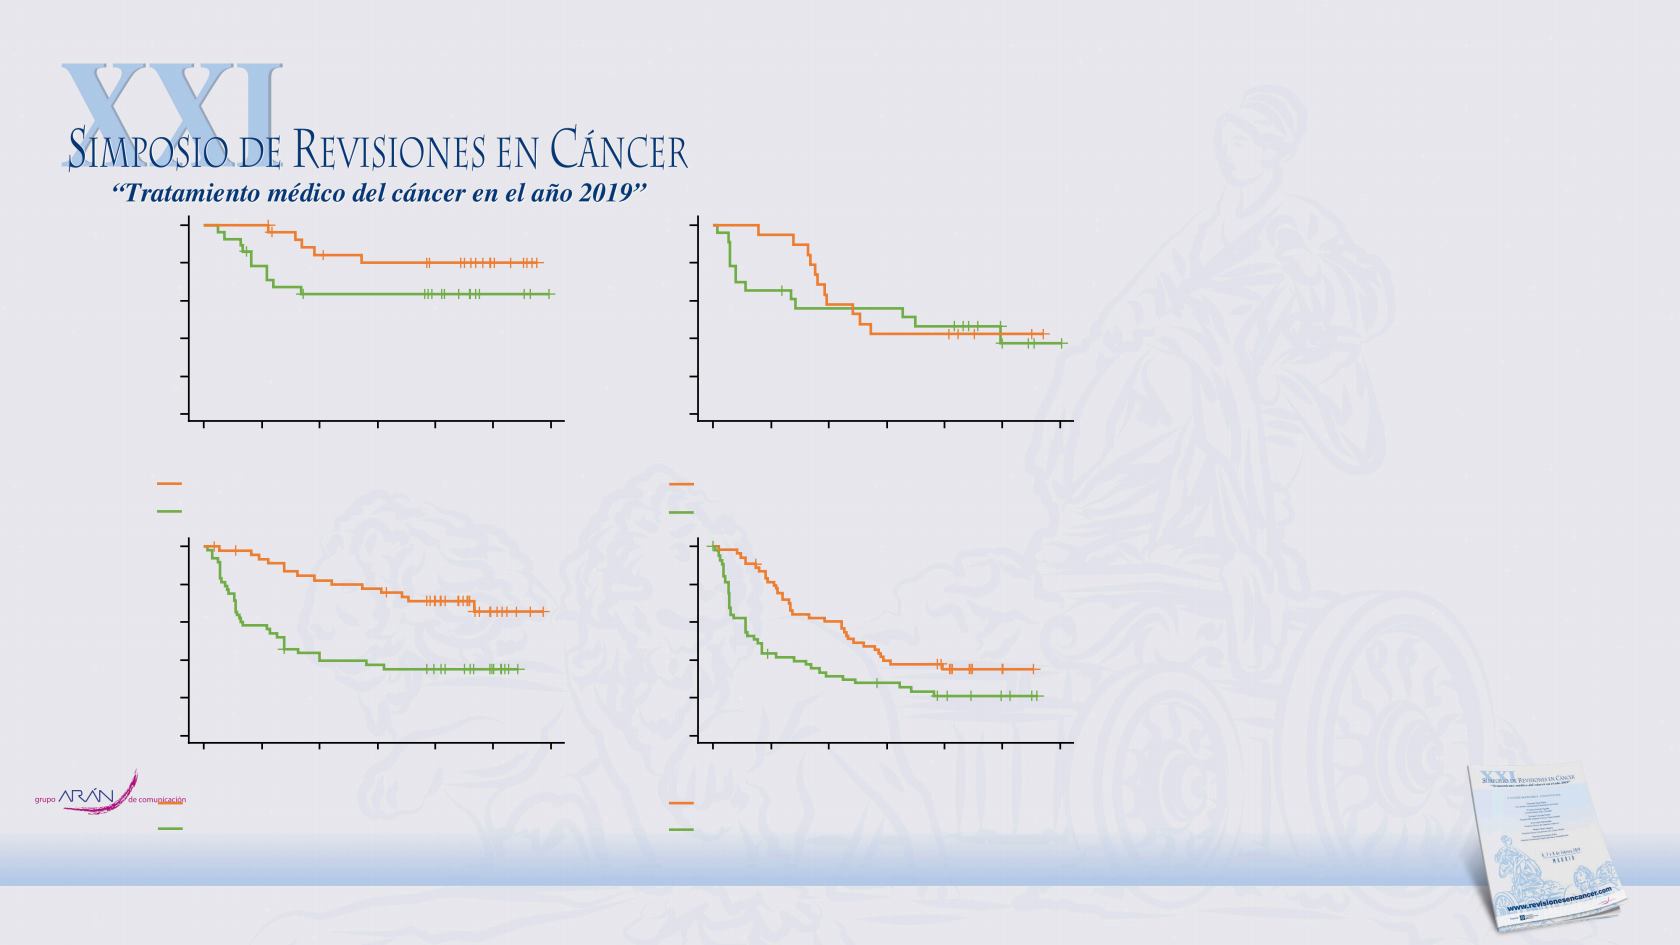
EXPLORATORY ANALYSIS OF THE
PREDICTIVE VALUE OF TMB/IFN-
γ
The analysis was not powered to
assess treatment interactions, but
results suggest that low TMB or
high TMB/high IFN-γ may be
associated with greater RFS
benefit than high TMB/low IFN-γ
PRESENTED BY GV LONG AT ESMO 2018
19 18 11 8 8 3
D+T
54 43 32 21 13 1
D+T
47 42 37 35 25 7
D+T
27 27 21 19 14 6
D+T
TMB High/IFN-γ High
TMB High/IFN-γ Low
TMB Low/IFN-γ High
TMB Low/IFN-γ Low
0 10 20 30 40 50 60
28 21 16 16 13 3
0 10 20 30 40 50 60
0 10 20 30 40 50 60
48 28 20 17 14 6
0 10 20 30 40 50 60
55 22 16 13 9 4
RFS, %
RFS, %
0
20
40
60
80
100
0
20
40
60
80
100
RFS, %
RFS, %
0
20
40
60
80
100
0
20
40
60
80
100
Months
Months
Months
Months
PBO
PBO
PBO
0
0
23 15 12 12 10 4 1
PBO
0
0
0
0
0
No. at risk
No. at risk
No. at risk
No. at risk


