21
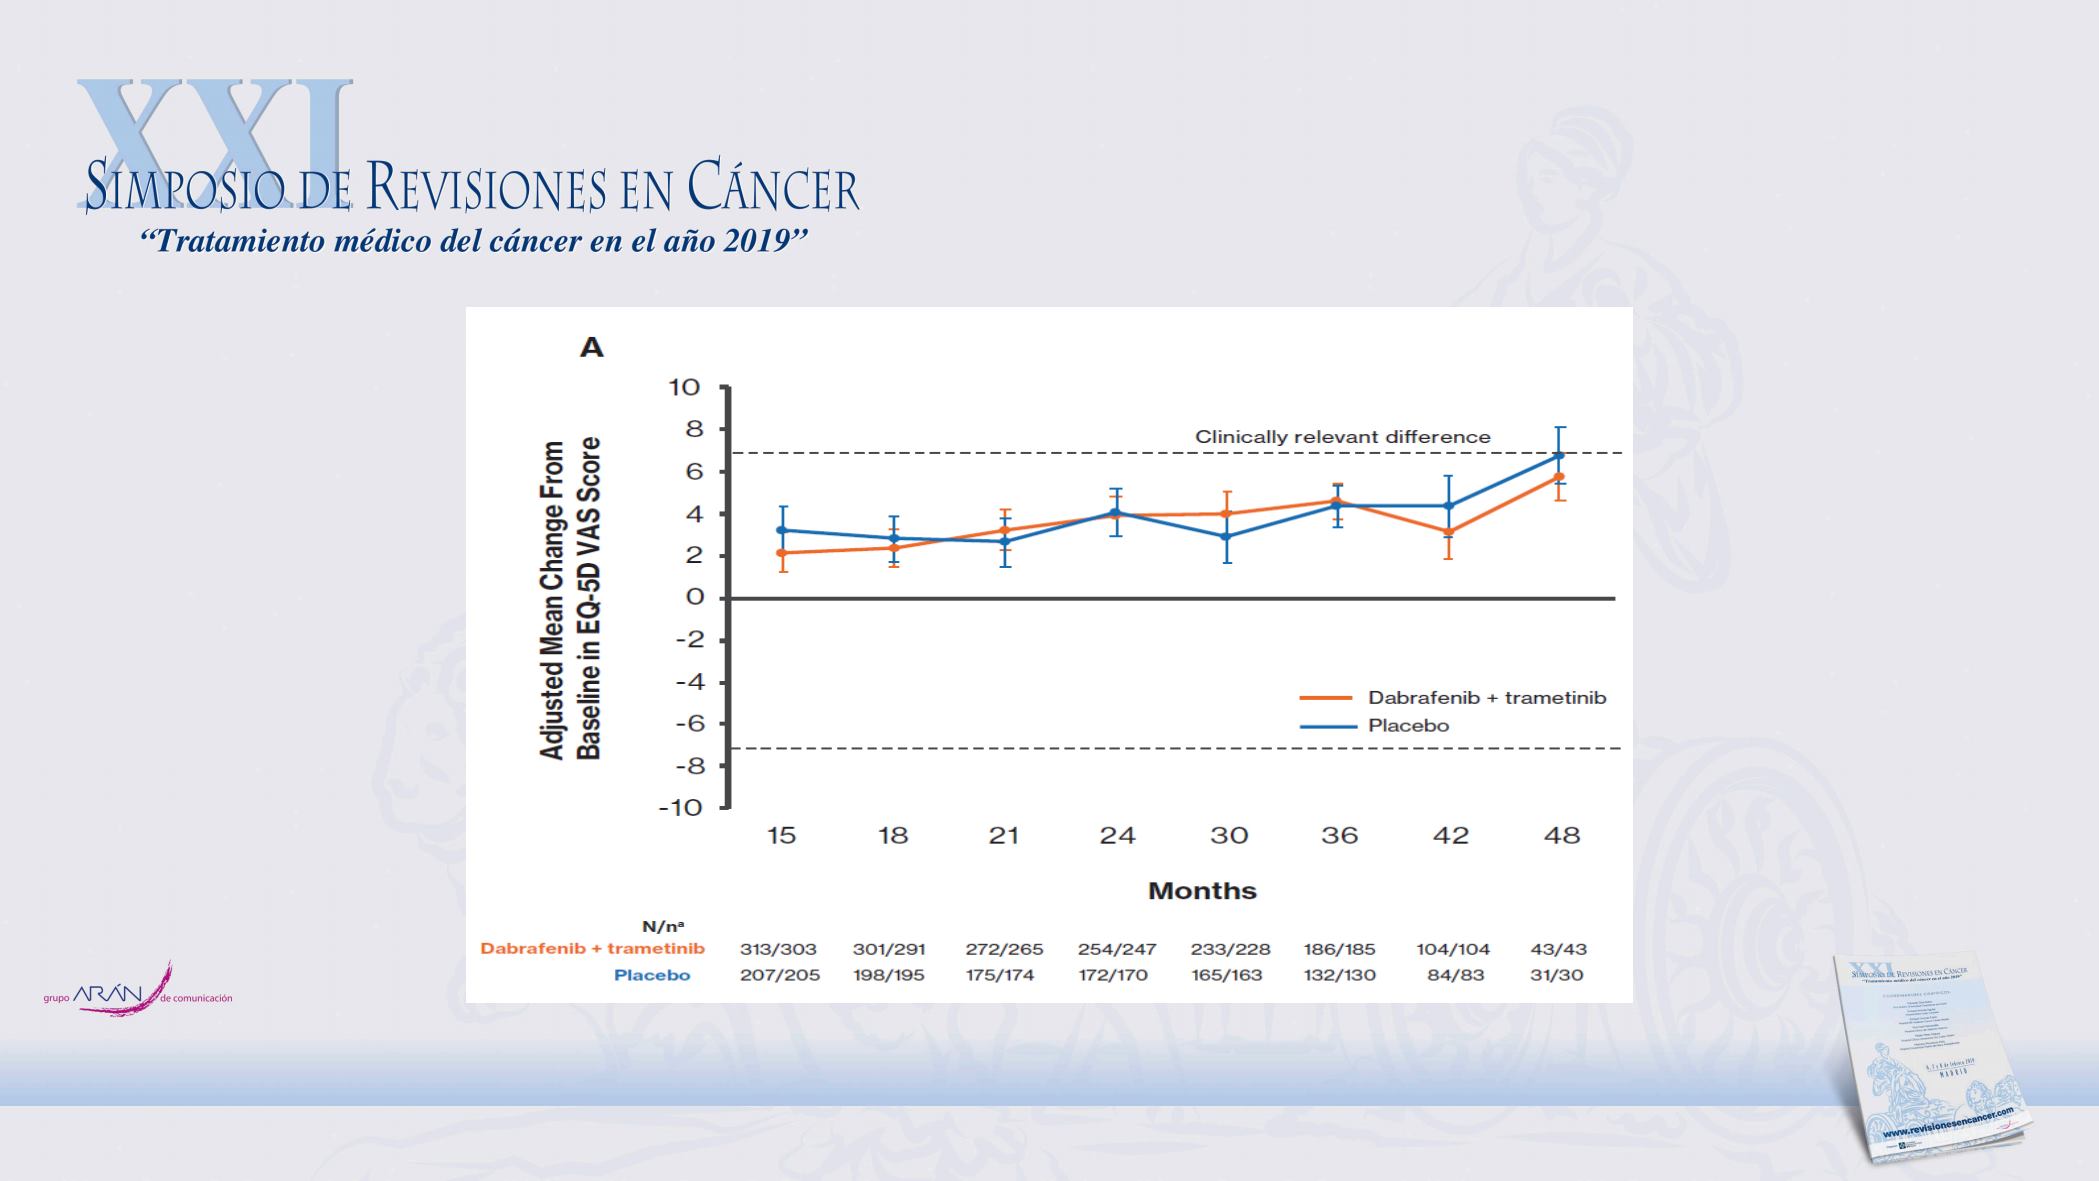
Adjusted Mean Change From Baseline in EQ-5D VAS
(A) and Utility (B) Scores During Long-Term
Follow-Up
a
N represents the corresponding number of patients with nonmissing score at each time point. n represents the corresponding number of patients with all available covariates at each time point. Dashed lines represent the threshold for clinically
meaningful changes from baseline.
Schadendorf D, et al ASCO 2018


